Dynamic Pie Chart Example using Struts 2 and Highchart
In this Struts 2 tutorial, we are going to create the Pie Chart using Highcharts. Highcharts is a pure JavaScript based charting library meant to enhance web applications by adding interactive charting capability. Highcharts supports line, spline, area, areaspline, column, bar, pie, scatter, angular gauges, arearange, areasplinerange, columnrange and polar chart.
Note: Series Array retrieved form MySQL database via
jQuery.getJSON()method.
Software/Library Used
In this example, I have used the following software’s/libraries.
- Eclipse IDE
- Tomcat 8
- JDK 8
- Struts2.3.x
- Highcharts Library
- jQuery Library
- MySQL Database
Resolve JAR Dependency
Add the following dependency in your pom.xml. If you are not using the Maven, you can directly add the jars in lib folder.
<dependencies>
    <dependency>
        <groupId>org.apache.struts</groupId>
        <artifactId>struts2-core</artifactId>
        <version>2.3.16</version>
    </dependency>
    <dependency>
        <groupId>mysql</groupId>
        <artifactId>mysql-connector-java</artifactId>
        <version>5.1.17</version>
    </dependency>
    <dependency>
        <groupId>org.apache.struts</groupId>
        <artifactId>struts2-json-plugin</artifactId>
        <version>2.3.8</version>
    </dependency>
</dependencies>
Project Structure in Eclipse
Have a look of project structure in Eclipse IDE.
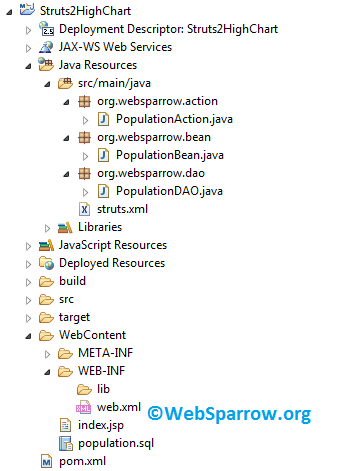
Table Structure
Pie Chart record retrieved form the below table.
| Country Name | State Name | State Population |
|---|---|---|
| INDIA | NEW DELHI | 3323 |
| INDIA | UTTAR PRADESH | 8838 |
| INDIA | GOA | 7364 |
| INDIA | RAJASTHAN | 6477 |
| INDIA | MAHARASHTRA | 5484 |
| INDIA | GUJRAT | 4020 |
Add Struts 2 Filter
Define the Struts 2 filter in web.xml
<?xml version="1.0" encoding="UTF-8"?>
<web-app xmlns:xsi="http://www.w3.org/2001/XMLSchema-instance" xmlns="http://java.sun.com/xml/ns/javaee"
	xsi:schemaLocation="http://java.sun.com/xml/ns/javaee http://java.sun.com/xml/ns/javaee/web-app_2_5.xsd"
	id="WebApp_ID" version="2.5">
	<display-name>Struts2HighChart</display-name>
	<welcome-file-list>
		<welcome-file>index.jsp</welcome-file>
	</welcome-file-list>
	<filter>
		<filter-name>struts2</filter-name>
		<filter-class>org.apache.struts2.dispatcher.ng.filter.StrutsPrepareAndExecuteFilter</filter-class>
	</filter>
	<filter-mapping>
		<filter-name>struts2</filter-name>
		<url-pattern>/*</url-pattern>
	</filter-mapping>
</web-app>
Bean Class
Define all the parameters that you want to retrieve form table and generates its getters and setters.
package org.websparrow.bean;

public class PopulationBean {
	private String stateName;
	private int statePopulation;

	public int getStatePopulation() {
		return statePopulation;
	}

	public void setStatePopulation(int statePopulation) {
		this.statePopulation = statePopulation;
	}

	public String getStateName() {
		return stateName;
	}

	public void setStateName(String stateName) {
		this.stateName = stateName;
	}
}
DAO Class
Create a DAO class to retrieve the records from the database.
package org.websparrow.dao;

import java.sql.Connection;
import java.sql.DriverManager;
import java.sql.ResultSet;
import java.sql.Statement;

public class PopulationDAO {

	public static Connection connect() {
		try {
			Class.forName("com.mysql.jdbc.Driver");
			return DriverManager.getConnection("jdbc:mysql://127.0.0.1:3306/websparrow", "root", "");
		} catch (Exception e) {
			e.printStackTrace();
			return null;
		}
	}

	public static ResultSet countryPopulation() {
		ResultSet rs = null;
		try {

			Statement statement = connect().createStatement();
			rs = statement.executeQuery("SELECT STATE_NAME,STATE_POPULATION FROM POPULATION");

			return rs;

		} catch (Exception e) {
			e.printStackTrace();
			return null;
		}
	}
}
Action Class
Inside the action class, add the records into an ArrayList
package org.websparrow.action;

import java.sql.ResultSet;
import java.util.ArrayList;
import java.util.List;

import org.websparrow.bean.PopulationBean;

import com.opensymphony.xwork2.ActionSupport;

public class PopulationAction extends ActionSupport {

	private static final long serialVersionUID = 2882111388038801283L;

	private List<PopulationBean> populationList = new ArrayList<PopulationBean>();
	ResultSet rs = null;
	PopulationBean populationBean = null;

	@Override
	public String execute() throws Exception {

		try {
			rs = org.websparrow.dao.PopulationDAO.countryPopulation();
			if (rs != null) {
				while (rs.next()) {
					populationBean = new PopulationBean();
					populationBean.setStateName(rs.getString("state_name"));
					populationBean.setStatePopulation(rs.getInt("state_population"));
					populationList.add(populationBean);
				}
			}

		} catch (Exception e) {
			e.printStackTrace();
		}

		return "SUCCESS";
	}

	public List<PopulationBean> getPopulationList() {
		return populationList;
	}

	public void setPopulationList(List<PopulationBean> populationList) {
		this.populationList = populationList;
	}
}
struts.xml
Now map your action class in struts.xml. We will need to set package extends="json-default" result type is json
<?xml version="1.0" encoding="UTF-8" ?>
<!DOCTYPE struts PUBLIC
"-//Apache Software Foundation//DTD Struts Configuration 2.0//EN"
"http://struts.apache.org/dtds/struts-2.0.dtd">
<struts>
	<constant name="struts.devMode" value="true" />
	<package name="default" namespace="/" extends="json-default">
		<action name="population" class="org.websparrow.action.PopulationAction">
			<result name="SUCCESS" type="json"></result>
		</action>
	</package>
</struts>
JSP Page
On the jsp page, send the request using jQuery $.getJSON() method and iterate the list into an Array and pass it to series option.
<!DOCTYPE html>
<html>
    <head>
        <title>State Population Report (Pie Chart)</title>

        <script type="text/javascript" src="https://code.jquery.com/jquery-3.2.1.min.js"></script>
        <script type="text/javascript" src="https://code.highcharts.com/highcharts.js"></script>

        <script type="text/javascript">

            $(document).ready(function () {

                var populationDataArray = [];

                $.getJSON("population.action", function (data) {

                    $.each(data.populationList, function (index) {

                        populationDataArray[index] = ['' + this.stateName + '', this.statePopulation];

                    });

                    var chart = {
                        plotBackgroundColor: null,
                        plotBorderWidth: null,
                        plotShadow: false
                    };

                    var title = {
                        text: 'State Population Report (Pie Chart)'
                    };

                    var tooltip = {
                        pointFormat: '{series.name}: <b>{point.y}</b>'
                    };

                    var plotOptions = {
                        pie: {
                            allowPointSelect: true,
                            cursor: 'pointer',
                            dataLabels: {
                                enabled: true,
                                format: '<b>{point.name}</b>: {point.y}',
                                style: {
                                    fontSize: 10,
                                    color: (Highcharts.theme && Highcharts.theme.contrastTextColor) || 'black'
                                }
                            }
                        }
                    };

                    var series = [{
                            type: 'pie',
                            name: 'State Population',
                            data: populationDataArray
                        }];

                    var json = {};
                    json.chart = chart;
                    json.title = title;
                    json.tooltip = tooltip;
                    json.series = series;
                    json.plotOptions = plotOptions;
                    $('#population').highcharts(json);
                });
            });
        </script>
    </head>
    <body>
        <div id="population" style="float: left;"></div>
    </body>
</html>
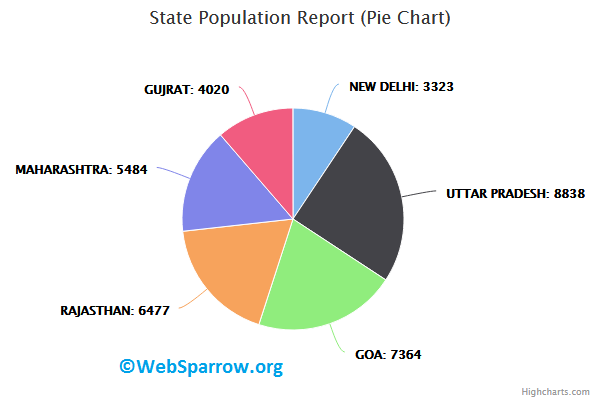
Demo
Run the application. You will get the below Pie Chart.
Download Source Code- dynamic-pie-chart-example-using-struts2-and-highchart.zip