Getting started with ELK Stack
This article will guide you on a basic overview of ELK (Elasticsearch, Logstash, and Kibana) Stack and how-to set up it on the local environment.
What is ELK?
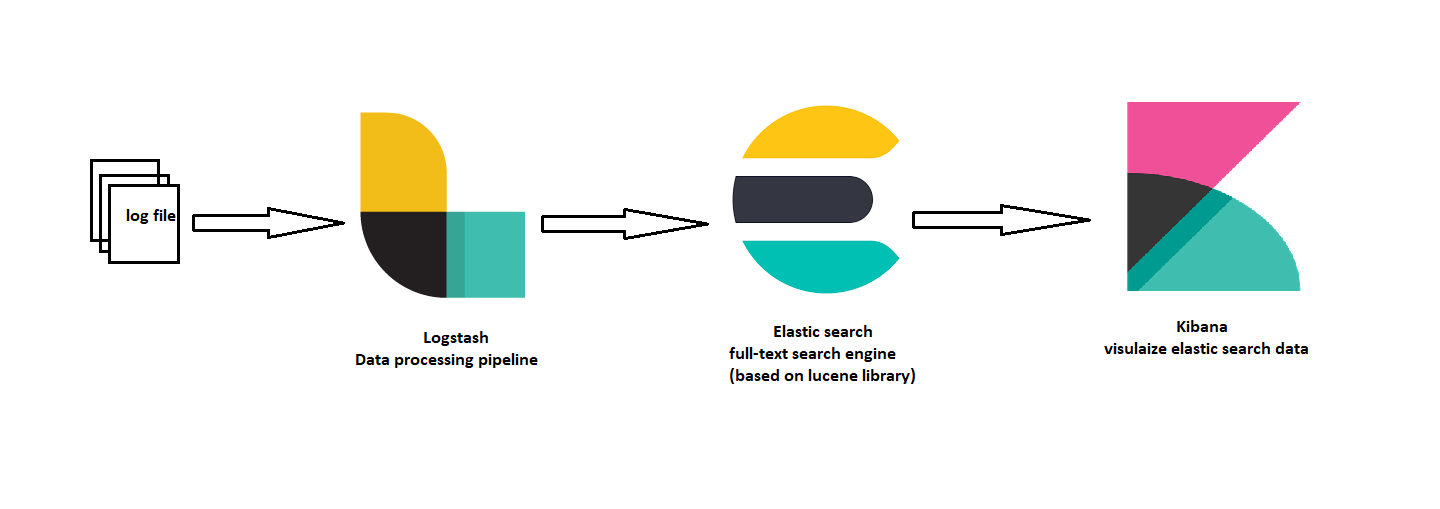
ELK is an acronym for three open-source projects:
- (E)lasticsearch: full-text search engine based on Apache Lucene library
- (L)ogstash: data processing pipeline
- (K)ibana: visualize elastic search data
1. Elasticsearch
Elasticsearch is a document-oriented search engine that means that you can save documents into elastic search or you could delete documents from elastic search and along with this you can perform basic insert and delete functionality and retrieve these stored documents and even perform various analytics.
Elasticsearch is built on top of Apache Lucene library, the underlying data structure used in that software is known as an inverted index. An inverted index basically maps words or numbers to actual document locations of where those words occur. When you insert a document into an elastic search using commands, it takes these documents and organizes them into an inverted indexed data structure so that searching is possible.
1.1 Prerequisite for Elasticsearch
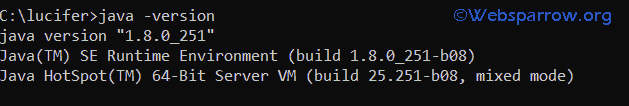
- JAVA 1.8 or above
1.2 Steps for Elasticsearch local setup
Follow the below steps to set up the Elasticsearch on your local machine.
Step 1: Open the command prompt and check if Java is installed properly.
Step 2: Download and unzip the Elasticsearch from the below link.
Step 3: Go to Elasticsearch folder and run below the .bat file for Windows machine
>{path to elasticsearch}> bin\elasticsearch.batStep 4: Elasticsearch will up and running on 9200 port: http://localhost:9200
{
  "name" : "DESKTOP",
  "cluster_name" : "elasticsearch",
  "cluster_uuid" : "TaA9WUtsTlGeZAacW3kQwQ",
  "version" : {
    "number" : "7.8.0",
    "build_flavor" : "default",
    "build_type" : "zip",
    "build_hash" : "757314695644ea9a1dc2fecd26d1a43856725e65",
    "build_date" : "2020-06-14T19:35:50.234439Z",
    "build_snapshot" : false,
    "lucene_version" : "8.5.1",
    "minimum_wire_compatibility_version" : "6.8.0",
    "minimum_index_compatibility_version" : "6.0.0-beta1"
  },
  "tagline" : "You Know, for Search"
}
2. Kibana
Kibana is an open-source tool to visualize your elastic search data. Users can create bar, line, pie charts on a large volume of data.
2.1 Prerequisite for Kibana setup
- Up and running Elasticsearch
2.2 Steps for Kibana local setup
Follow the below steps to set up the Kibana on your local machine.
Step 1: Download and unzip the Kibana from the below link
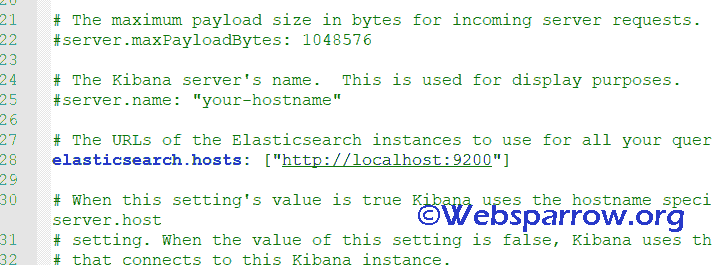
Step 2: Open kibana.yml file from config » Kibana and set elasticsearch.hosts to your running Elasticsearch instance. As our elastic search is running on http://localhost:9200, just uncomment the line number 28 which has key name elasticsearch.hosts.
Step 3: Execute the kibana.bat file from your command prompt to run Kibana.
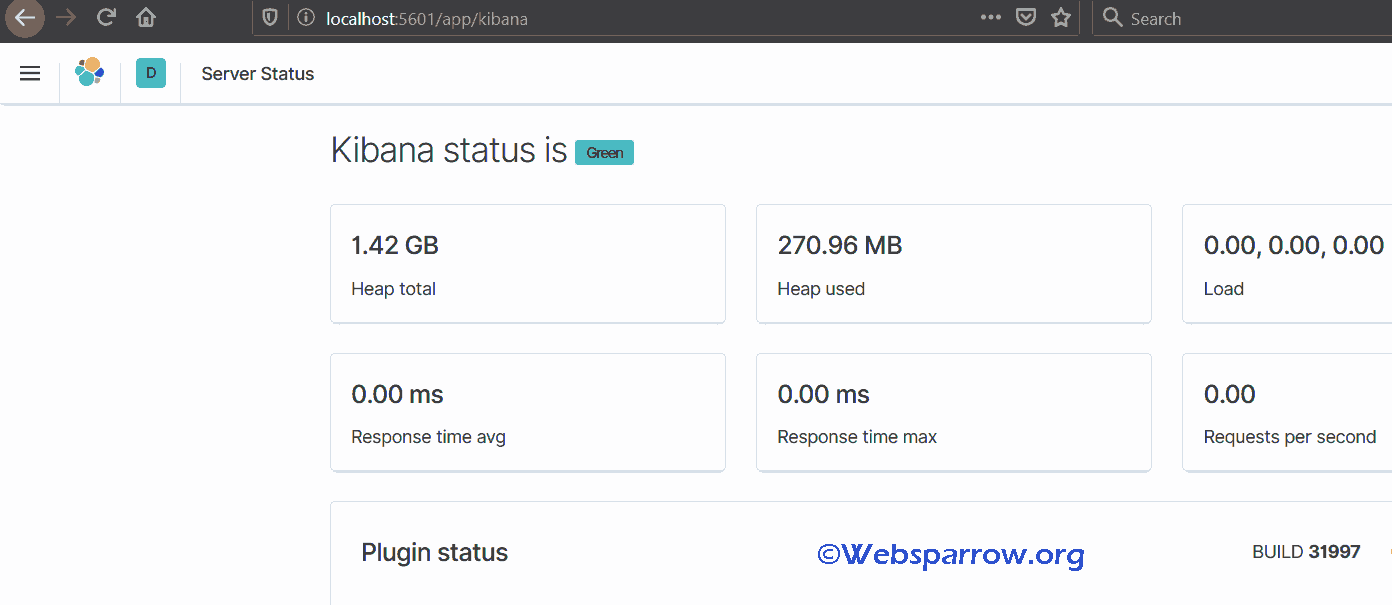
> {path to kibana}> bin\kibana.batStep 4: Open http://localhost:5601 on the web browser. Make sure your elastic search instance is up and running.
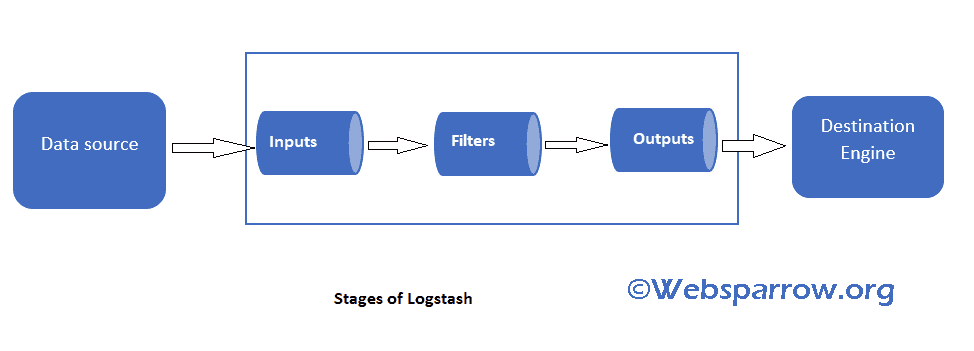
3. Logstash
Logstash is a very powerful open-source data processing pipeline engine and it is used to ingest data from a multitude of sources simultaneously. It does not matter the sources of data could be anything and you can ingest it into not only elastic search but other NO SQL engines.
There are three stages to the log stash pipeline:
- Inputs: getting data into the pipeline from the data source whatever that data sources and it goes into inputs.
- Filters: filtering process where you can filter out the data that you want and ignore the other data that you do not want.
- Outputs: Outputs make their way into a data destination whatever that may be either elastic search or any other engine.
3.1 Steps for Logstash local setup
Follow the below steps to set up the Logstash on your local machine.
Step 1: Download and unzip the Logstash from the below link.
Step 2: Prepare a config file for Logstash or use the below command to provide a command-line argument.
> {path to Logstash}> bin\logstash -e "input { stdin {} } output { stdout {} }"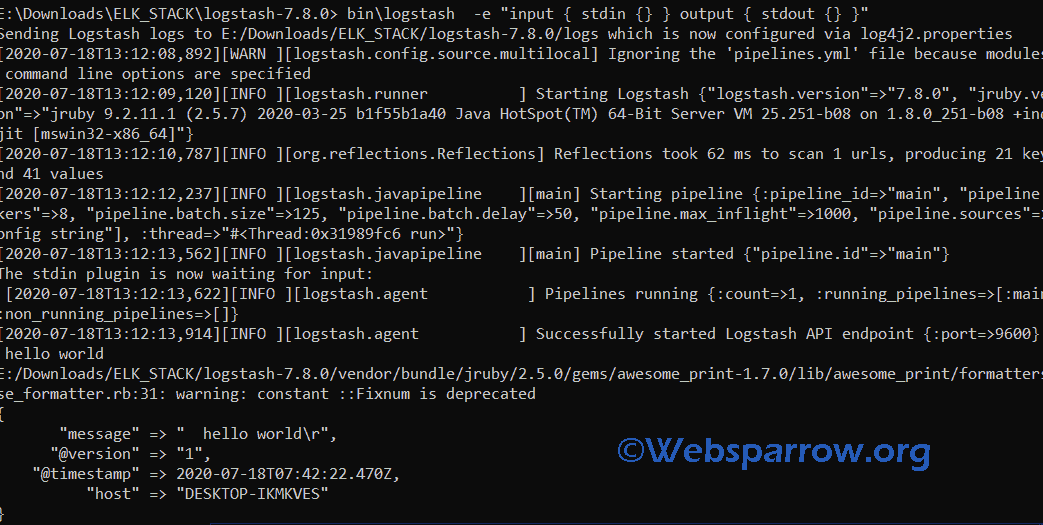
As you can see, log stash is up and running then I typed “hello world”, so Logstash took standard input and provides a standard output.
3.2 Logstash config file
Now in this section we will use logs file and create a config file and ingest it, filters the data, and provide output into Elasticsearch.
1. Dummy log link which we will use in this tutorial.
2. Prepare the config file.
input
{
	#here we have used file plugin of logstash, specify what file we want to ingest
	file {
		#location of log file
		path => "E:/Downloads/ELK_STACK/logs/logs"
		type => "logs"
		start_position => "beginning"
	}
}
#multiple pulgins are used in this filter stage
filter
{
	#grok plugin regular expression matcher, and we have used COMBINEDAPACHELOG here
	#you can use different pattern from this link https://github.com/elastic/logstash/blob/v1.4.2/patterns/grok-patterns
	grok{
		match => {
			"message" => "%{COMBINEDAPACHELOG}"
		}
	}
	#mutate convert data types
	mutate{
		convert => { "bytes" => "integer" }
	}
	#date plugin format dates
	date {
		match => [ "timestamp", "dd/MMM/YYYY:HH:mm:ss Z" ]
		locale => en
		remove_field => "timestamp"
	}
	#geoip filter gets client ip from request
	geoip {
		source => "clientip"
	}
	#useragent describes what agent user was using laptop/mobile
	useragent {
		source => "agent"
		target => "useragent"
	}
}

output
{
	#standard output on console
	stdout {
		codec => rubydebug
	}
	#output to elasticsearch hosts
 	elasticsearch {
		hosts => ["localhost:9200"]
  	}

}
3. Run the following command to start Logstash
#{path to logstash}> bin\logstash.bat -f {path to logconfig.conf}\logconfig.conf

> {path to logstash}> bin\logstash.bat -f E:\Downloads\ELK_STACK\data\logconfig.conf
-f is used to specify the config file path.
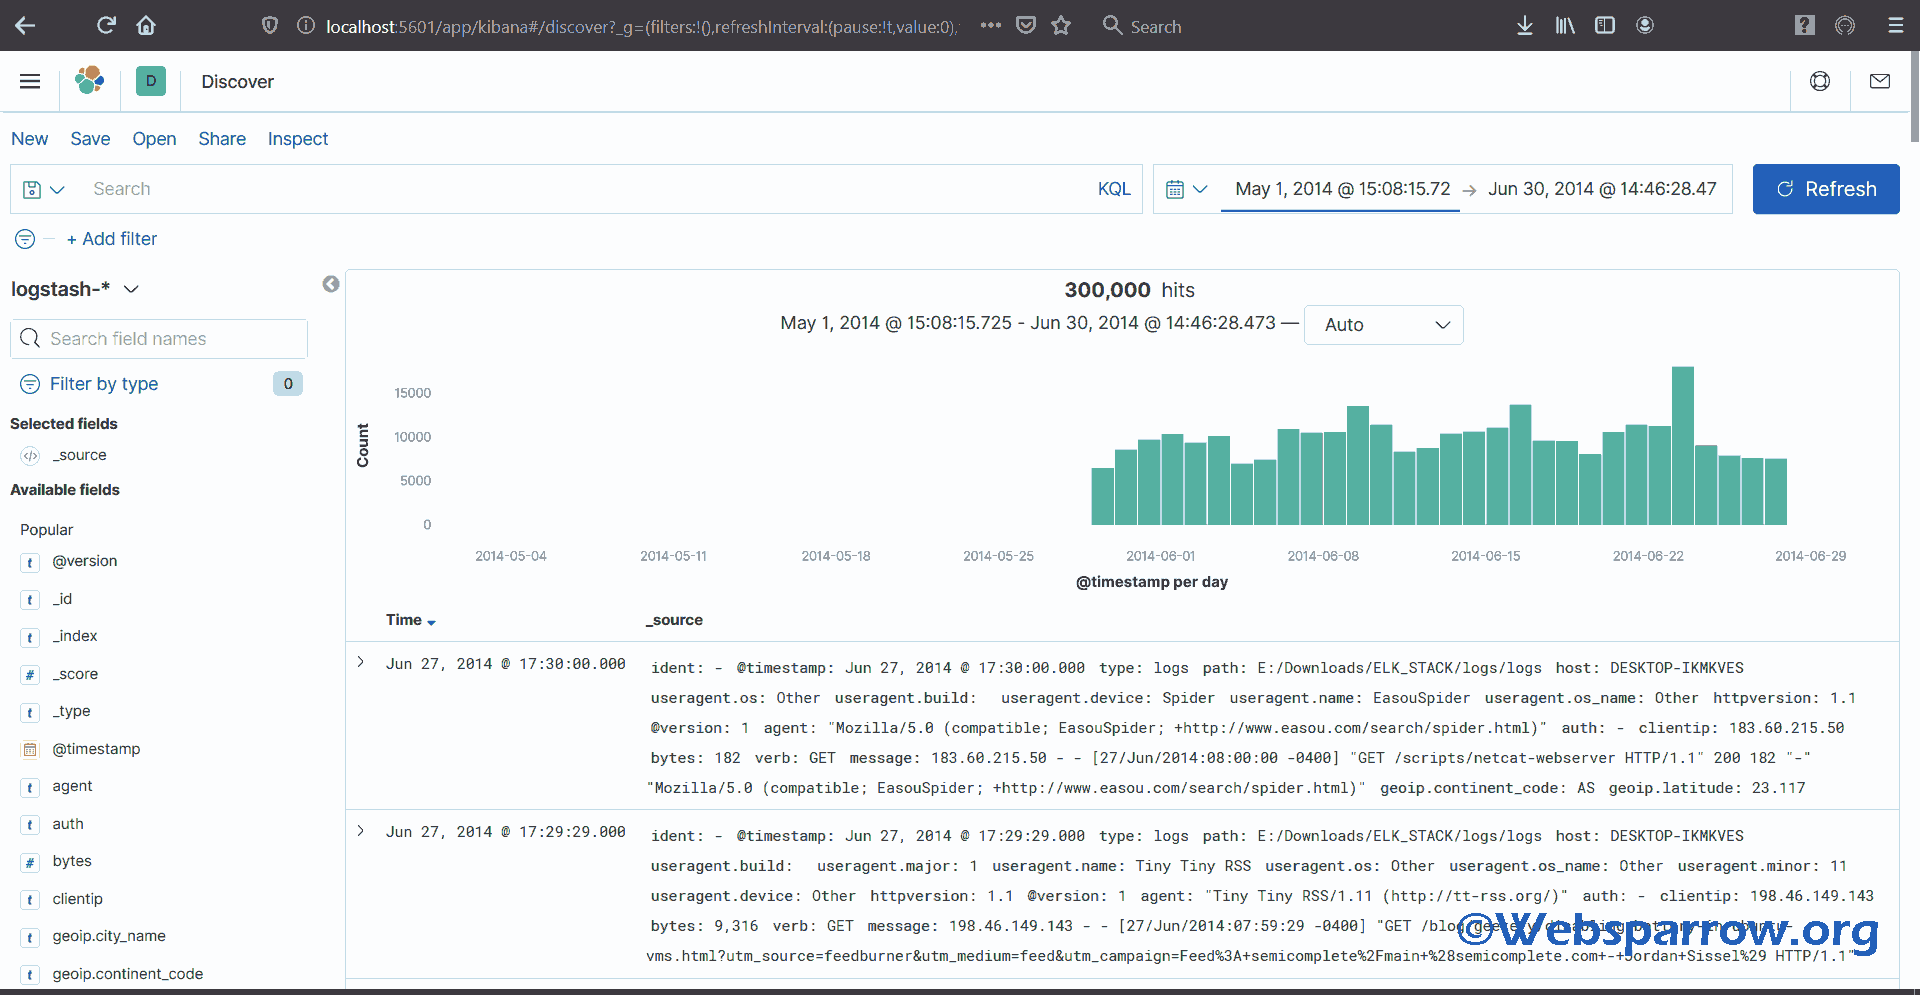
4. Now open Kibana and go to Discover tab, you will find your logs:
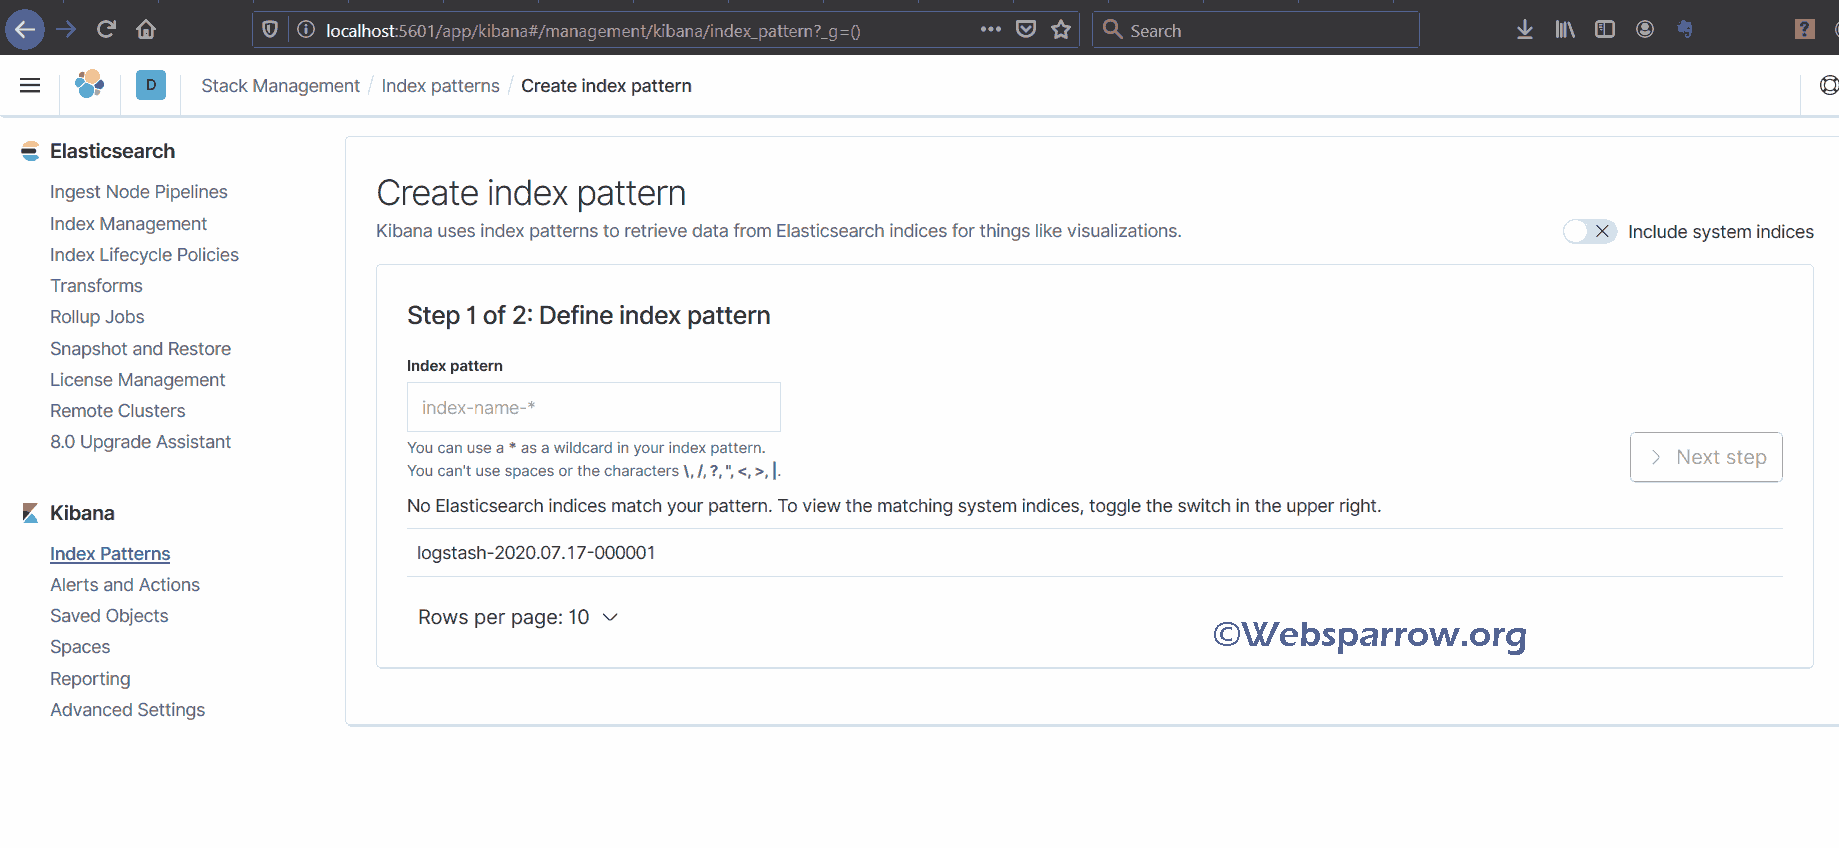
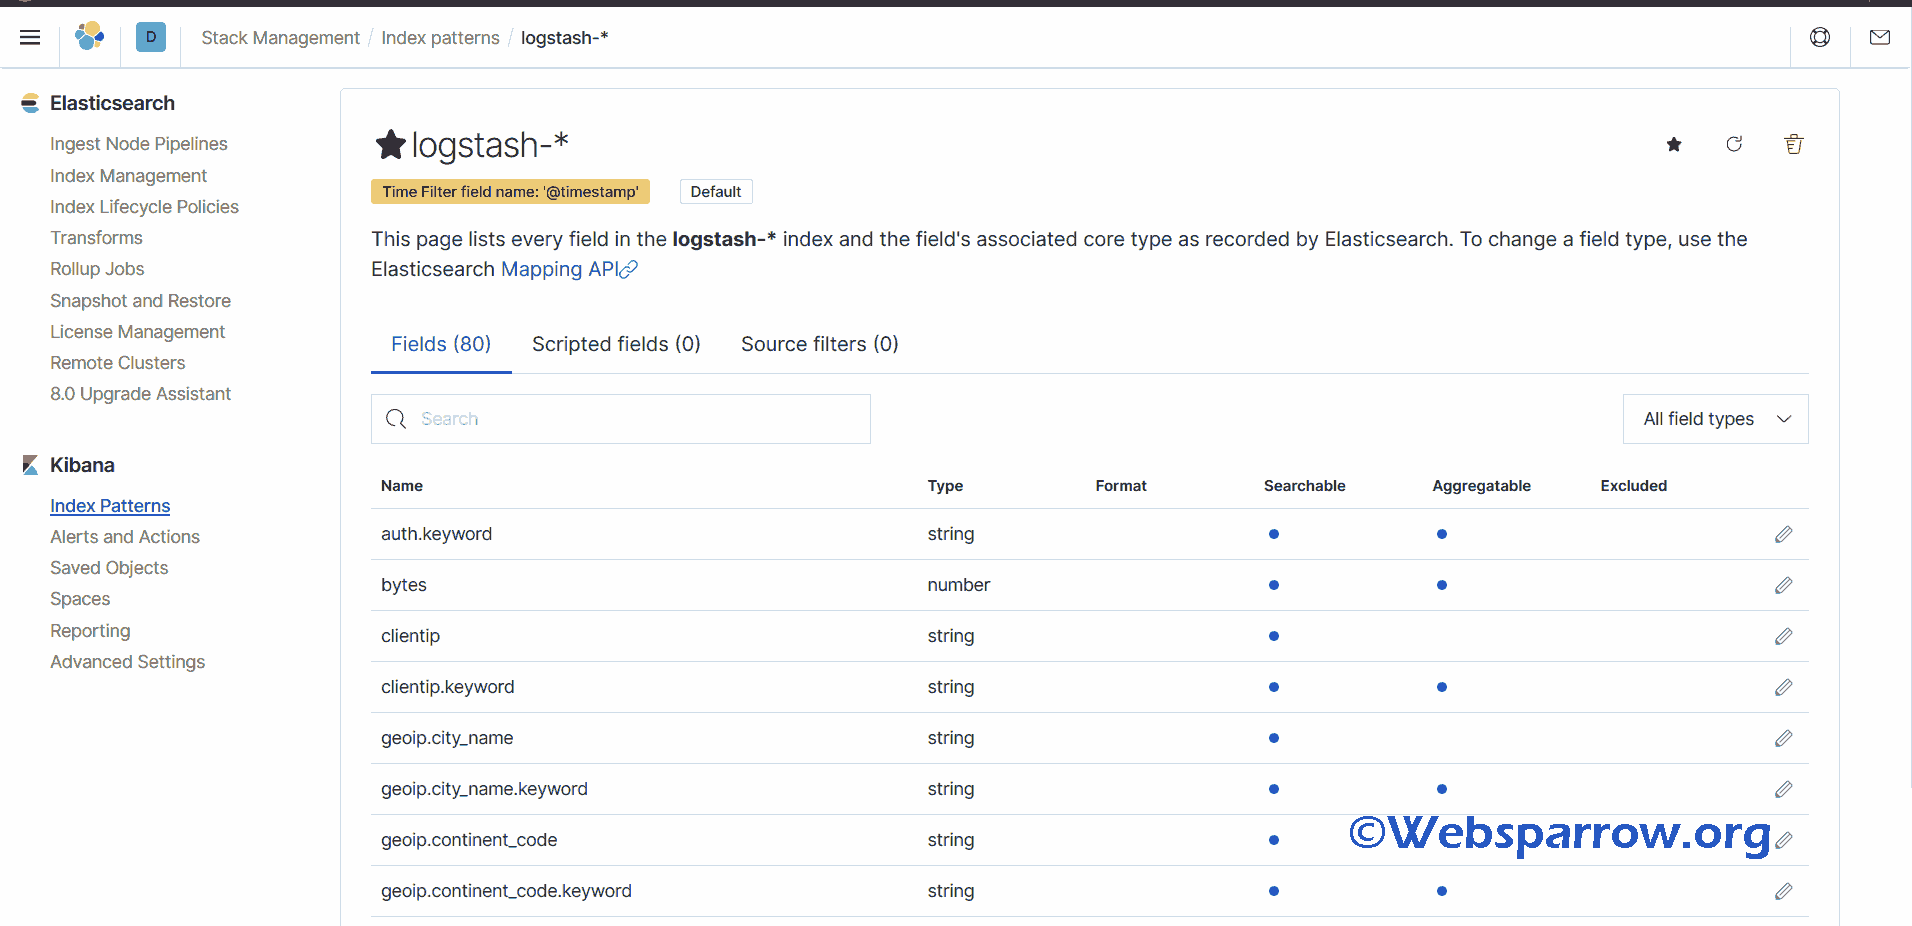
3.3 Create Index Pattern
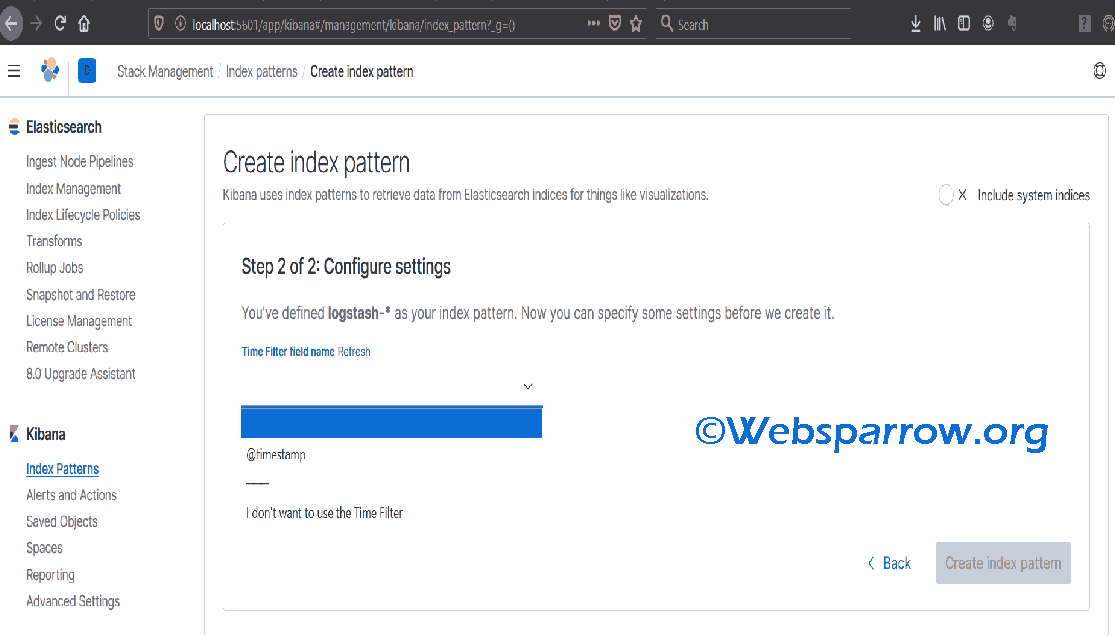
we can create an index pattern. Write “logstash-*” in the above text field and click on next. Select @timestamp from the drop-down and click on create index pattern.
Note: While writing an index pattern make sure it must match with Elastic search data indices. In our case, we had the following data indices.

Since we have created an index pattern “logstash-*”, “*” which means wildcard for patterns.
Remember the log file we have used has logs from May 2014 to June 2014, so you need to select those as the start date and end date from the Discover tab.
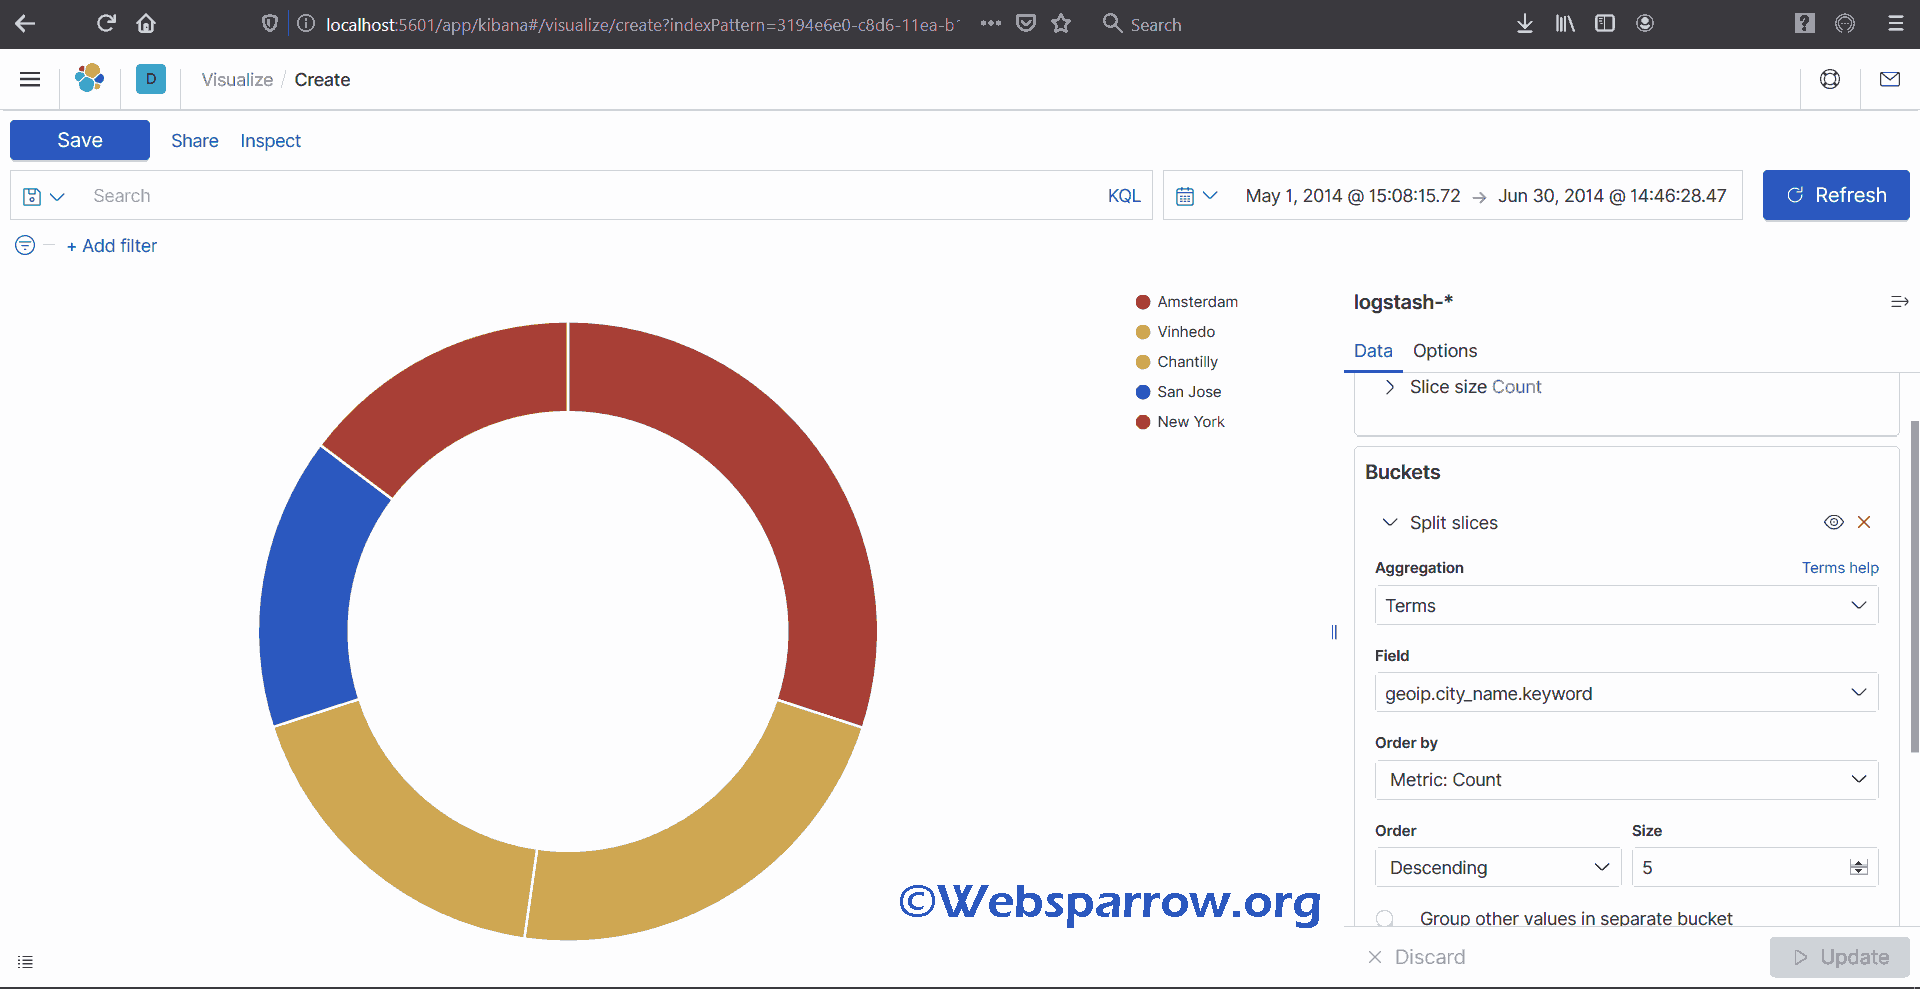
Now open the Visualization tab and set dates in visualization and click Refresh.
Visualization tab: This is pie visualization.
References
Similar Posts
Sorry, no similar posts were found.